Learn Observability by Investigating One Failure End to End
A controlled database-lock experiment connects monitoring, observability, six overlapping stages of development, Grafana Labs tools, and a practical path from symptoms to verified recovery.
This article started as an AI-generated draft and was reviewed before publication.
Learn Observability by Investigating One Failure End to End
Getting Grafana, Loki, and Tempo running is a useful first step.
Then pick one failed request. Explain where it went, where it spent its time, and what evidence supports your conclusion.
That is the learning standard I want to keep from this observability project: move from symptoms to a testable explanation, then verify recovery under the same conditions.
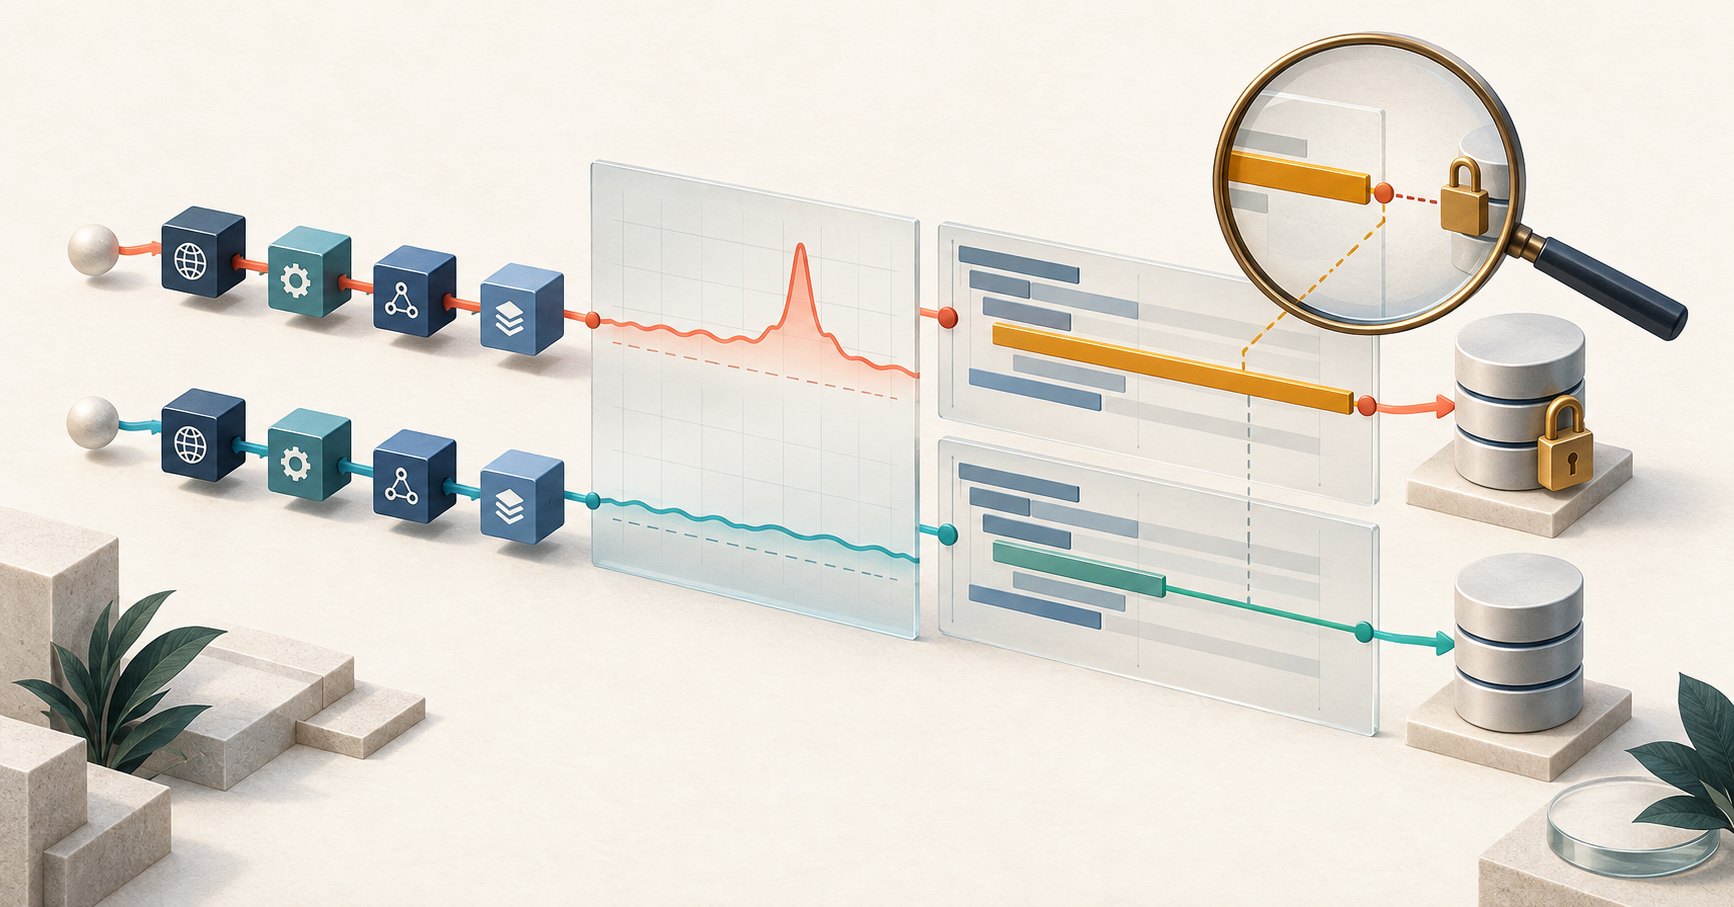
To make the concepts concrete, this project used Codex to help build and run a Grafana Labs teaching lab. API P95 latency rose from 7.33 ms to roughly three seconds, then returned to 8.59 ms after a database lock was released. The experiment gave metrics, traces, logs, and profiles a shared investigation context.
If you are learning observability, I recommend starting with a problem you can follow all the way through.
Monitoring and observability support the same investigation
Monitoring continuously checks service health, trends, and targets. Observability concerns our ability to understand a system's internal behavior from the signals it produces. They complement each other. This framing draws on the OpenTelemetry observability primer.
“Knowing something is broken” and “understanding why” make a useful introduction, but the work overlaps. Monitoring can support debugging, and an investigation can lead to new alert rules. Google SRE explicitly includes retrospective analysis and debugging among monitoring's uses. Source: Monitoring Distributed Systems
For a slow checkout, I would first look at success rate, latency, and scope. Then I would ask whether every request is slow or whether the problem is concentrated in a particular version, route, or dependency.
The first set of questions helps determine whether action is needed. The next helps narrow the investigation.
Useful observability gives the next question somewhere to go for evidence.
Six overlapping stages of development
I organize the expanding scope of observation into six teaching stages:
| Stage | Focus | A useful learning question |
|---|---|---|
| Infrastructure monitoring | Hosts, processes, networks, capacity | Does a running service imply successful requests? |
| APM | Application transactions, SQL, runtime | Which operation is behaving unexpectedly? |
| Distributed and cloud-native observation | Requests across services and changing dependencies | Where does this request wait? |
| Open standards | Shared instrumentation, transport, semantics | Do services preserve consistent context? |
| Cross-signal investigation and governance | Measurements, events, requests, versions | Can we connect evidence and manage its cost? |
| Deeper observation and assisted analysis | Profiles, eBPF, RUM, AI | Which evidence is still missing, and where are the limits? |
These “six generations” are a teaching framework. The stages overlap and capabilities accumulate. APM, tracing, and profiling have earlier histories; this table is neither a timeline of inventions nor a maturity ladder every team must climb.
One specific historical milestone is the 2019 merger of OpenTracing and OpenCensus into OpenTelemetry, bringing open instrumentation efforts together. Source: Google's merger announcement
For a learner, the useful progression is the range of questions: from a machine, to a request, to the outcome experienced by a user.
Read each signal with a question in mind
| Signal | What I would ask | A limitation to keep in view |
|---|---|---|
| Metrics | How widespread, how long, and which trend? | Aggregates usually cannot reconstruct every request |
| Traces | Which operations ran, and where did time go? | A slow span identifies a location; its cause needs evidence |
| Logs | Which events, errors, or state changes occurred? | Missing context can prevent request-level correlation |
| Profiles | Which functions consumed which resources? | CPU sample share does not equal total request waiting time |
Definitions for the first three appear in OpenTelemetry Signals. For continuous profiling, see the Pyroscope introduction. The questions and limits above are the interpretation guide used in this learning exercise.
Correlation also needs consistent service identity, environment, version, timestamps, and request context. OpenTelemetry supplies shared instrumentation and telemetry transport capabilities; backends provide their own storage and querying. Source: What is OpenTelemetry?
The skill I want to practice is specific: find a slow request, understand its span relationships, and retrieve events with the same trace ID. At every step, explain which filters and context were carried forward.
From three layers to five: unpack the telemetry pipeline
After identifying the signals, ask the next question: where is the data produced, what happens to it, and who uses it?
For a team discussion, start with three stages: Produce → Collect → Consume. SDKs or automatic instrumentation produce data, a Collector receives and processes it, and backends and Grafana make it available for investigation and action.
For design and troubleshooting, expand that outline into five concerns: Instrumentation, Signals, Transport, Collection / Processing, and Backend / Analysis. This is a teaching model used in this article. It is not an official five-layer OpenTelemetry architecture or a requirement to deploy five separate services.
① Instrumentation: who produces the data?
Manual instrumentation, library integrations, automatic instrumentation, and profilers determine which operations become visible. eBPF can add automatic observation in supported environments, with coverage constrained by the runtime, protocol, and tool.
A slow request needs a corresponding span, event, or measurement before a backend can help investigate it. Installing a Collector cannot reconstruct business information that the application never emitted.
② Signals / Data: what kind of data is it?
Metrics, logs, traces, and profiles describe measurements, events, relationships between operations, and code-level resource usage. They are data perspectives, not four collection tools or a sequence in which a metric turns into a log and then a trace.
This data concern spans the entire pipeline. Service identity, semantics, units, and context need to remain consistent. Useful profiling tools already exist, but the OTLP specification checked on September 20, 2026 still marks the profiles protocol as Development. Do not assume the same standards maturity or component support as the other three signals.
③ Transport: which protocol carries the data?
OTLP is the OpenTelemetry protocol for delivering telemetry, commonly through OTLP/gRPC or OTLP/HTTP. It can connect an application to a Collector and a Collector to a backend. Transport is a concern at these connections, not a single box between them. Source: OTLP Specification
A shared protocol reduces application coupling to a particular backend. The receiving side still needs compatible signals, encoding, endpoints, and authentication. Prometheus scraping, remote write, the Loki API, and profiling interfaces can coexist; the whole Grafana ecosystem should not be labeled OTLP.
④ Collection / Processing: how is data received, processed, and forwarded?
The OpenTelemetry Collector's basic model is Receiver → Processor → Exporter. Receivers accept pushes or actively scrape data. Optional processors handle work such as batching, field changes, or filtering, and exporters send the result onward. Components must support their pipeline's signal type. Source: Collector Architecture
Alloy connects components from OpenTelemetry, Prometheus, Loki, and Pyroscope into data flows. Batching, filtering, and trace sampling serve different purposes; a processor cannot be applied indiscriminately to every signal. A Collector is a common place to centralize processing, but compatible SDKs can also export directly to a backend. The extra hop is not mandatory in every deployment.
⑤ Backend / Analysis: how is data stored, queried, and understood?
In this learning stack, Mimir, Loki, Tempo, and Pyroscope handle metrics, logs, traces, and profiles respectively. Other architectures may use Prometheus, Jaeger, or commercial platforms. Grafana queries data sources and provides visualization, correlation, and alerting.
OpenTelemetry helps generate, describe, transport, and process telemetry; other tools provide storage and visualization. Shared standards reduce coupling, while query languages, retention policies, and data-model mappings can remain platform-specific. Source: What is OpenTelemetry?
The three-stage outline and five concerns therefore fit together like this:
- Produce: ① instrumentation emits data; ② signals describe it throughout the pipeline.
- Collect: ④ collection and processing; ③ transport connects sources, Collectors, and backends.
- Consume: ⑤ storage, querying, analysis, and visualization.
In the actual lab, traces reach Alloy over OTLP, Alloy scrapes metrics and remote-writes them to Mimir, logs use the Loki API, and profiles use Pyroscope interfaces. These five concerns help explain the different paths without recasting the verified setup as an imaginary all-OTLP deployment.
The three pillars describe data types, the three-stage model describes work, and the five concerns clarify responsibility. The six historical teaching stages earlier in the article describe how capabilities accumulate—a different dimension.
Understand each Grafana Labs tool's responsibility
The Grafana Labs ecosystem becomes easier to learn when its tools are placed along the data flow:
| Responsibility | Tools | Role in this learning path |
|---|---|---|
| Collect and process | Alloy | Receive, process, and forward telemetry |
| Store and query signals | Mimir, Loki, Tempo | Metrics, logs, and traces respectively |
| Investigate | Grafana | Query, visualize, correlate, and alert |
| Validate under controlled conditions | k6 | Repeat workloads across failure and recovery |
| Examine code resource use | Pyroscope | Collect and analyze profiles continuously |
| Observe browser experience | Faro | Frontend errors, experience, and requests |
| Add automatic instrumentation | Beyla | Use eBPF to add visibility for supported services |
| Manage deployment configuration | Tanka | Manage Kubernetes configuration through Jsonnet |
See the Grafana Labs open-source project directory for product positioning. The learning sequence here is my interpretation, rather than an official installation checklist.
In this lab, the application produces signals, Alloy routes them to the appropriate backends, and Grafana queries those backends. k6 sends controlled requests from the client side. Tanka belongs to configuration management, outside the runtime request and telemetry paths.
My recommendation is to complete the metrics, traces, and logs investigation path first. Add Faro when browser experience is the question. Add Pyroscope when code resource consumption is the question. Each new component should fill an identifiable information gap.
A database lock makes the learning goal testable
The lab builds on Grafana's official intro-to-mltp example, with a pinned upstream revision and three sequential phases: baseline, database lock, and recovery.
Each phase uses the same k6 configuration: two requests per second to a selected API for 30 seconds, with a three-second client timeout. The lab also has background traffic. The injected fault holds a table lock for approximately 20 seconds in the isolated teaching environment.
The September 19, 2026 run produced:
| Phase | k6 P95 latency | Client failure rate |
|---|---|---|
| Baseline | 7.33 ms | 0% |
| Database lock | 3001.82 ms | 62.30% |
| Recovery | 8.59 ms | 0% |
These measurements come from the saved k6 results for this lab, not an official Grafana benchmark. The short experiment checks a failure-and-recovery pattern. It does not establish product capacity, a production SLO, or comparative platform performance.
The investigation starts with the measurements and test results to establish a time window. It then finds a slow trace, identifies the time-consuming database operation, and queries logs using the same trace ID.
One question remains: what supports the database-lock explanation?
Here, the evidence includes the recorded locking transaction, requests waiting in database operations, and recovery after the lock was released under the same test configuration. A long database span by itself would leave other explanations open.
Another useful detail: the client timed out at roughly three seconds, while one representative server trace lasted about 18.38 seconds. Server work may continue after the client stops waiting. The two durations therefore represent different measurement boundaries.
Profiles were verified at the service and time-window level; per-span profile correlation was not verified. Beyla and Tanka remain optional exercises that were not executed in this run.
Leave a checkable result at every step
I would organize a first practice session around five actions:
- Choose one user path. Define success, failure, latency, and the measurement location.
- Understand the baseline. Save normal metrics, a trace, and related logs. Check that their context matches.
- Inject one recoverable fault in isolation. Set a time limit, cleanup procedure, and stop condition.
- Write a hypothesis, then investigate. Record supporting and conflicting evidence. Distinguish the slow operation from its cause.
- Verify recovery under the same conditions. Save queries, time windows, and results so another engineer can repeat the investigation.
For a team, this exercise also exposes ownership questions. Who maintains instrumentation? Who decides the fields and retention policy? Who checks that correlation still works after a version change?
Every added component brings collection, storage, querying, upgrade, and teaching costs. My adoption test is whether the new data answers a question that currently matters, and whether the team can maintain the capability.
✅ Find a concrete request from a symptom.
✅ Explain what the evidence supports and what it leaves unresolved.
✅ Help a teammate reproduce the queries and recovery check.
📌 A well-explained failure gives the next architecture decision a stronger foundation.
AI can help generate instrumentation, queries, and candidate hypotheses. Engineers still need to understand measurement boundaries and inspect execution results. That is part of the capability I want to develop through observability.
When your next API slows down, can your team follow the first warning all the way to evidence that supports action?
Continue with related articles and stay within the same technical thread.
Operability before scale
Why release flow, observability, and debugging habits should arrive before platform complexity does.
Three loops for AI agents: ReAct, Reflexion, and Generative Agents
Reading ReAct, Reflexion, and Generative Agents through actions, feedback, and memory, with practical checks for a research-to-publication workflow.
Simplifying My AI Workflow: Clear Ownership for Knowledge, Work, and Publishing
How I am retiring my custom Content Studio and assigning clear roles to Zotero, Heptabase, Linear, Codex, and Git, with complete article and image review before publication.